

"Traffic is up 20% this month." It sounds like good news until someone asks the next question: did we get more customers? If the dashboard on screen is GA4's default Reports snapshot, you probably can't answer that without digging. Sessions, pageviews and engagement rate tell you how busy the site was. None of them tell you whether the business grew.
This is the dashboard I build for clients once their tracking is confirmed accurate. It's built around four metrics, in a specific order, and it deliberately leaves most of GA4's default view out.
Why the default view doesn't answer the real question
GA4's out-of-the-box reports lead with volume: Sessions, Active users, Views, Engagement rate. Useful for diagnosing a problem once you have one, but dangerous as a headline number, because traffic and outcomes can move in opposite directions without anyone noticing.
A few ways that happens in practice:
- An SEO win brings in a wave of visitors searching for something adjacent to what you sell. Sessions climb, leads don't.
- A referral or bot source inflates
Sessionswith traffic that was never going to convert, and nobody notices because the headline number looks healthy. - A paid campaign gets more efficient at driving clicks but worse at driving the right visitors, so cost per session drops while cost per lead quietly rises.
In every case, a traffic-led dashboard shows green. The business didn't move. If your reporting can't tell the difference, you'll keep funding the wrong channel and nobody will know until the pipeline dries up.
The four metrics worth an executive's attention
1. Key events, not pageviews
Before this number means anything, the events behind it need to be trustworthy. A generate_lead or schedule_call event that fires on a button click instead of a confirmed success inflates the count with abandoned attempts, the same problem I cover in why GA4 doesn't match your inbox. Once the signal is clean, Key events becomes the one number on the dashboard that answers "did we get more business," plainly, without translation.
2. Key events by channel, not sessions by channel
"Paid Social sent us 4,000 sessions" tells you nothing about whether to keep spending there. "Paid Social sent us 6 leads, Organic Search sent us 40" tells you exactly where the next euro should go. Break Key events down by Session source / medium instead of leading with the sessions table GA4 gives you by default. The ranking is frequently not what the sessions table would suggest.
3. Conversion rate trend, not raw totals
Raw Key events can rise purely because traffic rose, while the site itself is converting worse than it did last month. Plot Session key event rate (the share of sessions with at least one key event) as a trend line alongside the raw count. Don't divide Key events by Sessions yourself: one session can fire several key events, so that number isn't a real rate. If the count is up but the rate is down, growth is being bought with more traffic rather than a genuinely better funnel, and that's a different conversation with a different budget line.
4. Top landing pages by key events, not by views
GA4's Top pages/screens table defaults to sorting by Views, which produces a popularity ranking, not a performance one. Pull the same table but sort by Key events instead. It's common to find your highest-traffic landing page converts close to zero, while a page three pages down the views list is quietly carrying most of your pipeline. That's the page worth investing more content and internal links into, and the first one worth a conversion audit if it's underperforming its own traffic.
A focused GA4 audit checks your key events for accuracy before you build a dashboard on top of them.
Building this in Data Studio
GA4's own Reports snapshot can be customized to lead with most of this (Reports → Reports snapshot → the pencil icon, Customize report), which is enough for a daily personal check. I use Data Studio for anything shared with a team or a client, because it blends data sources and isn't locked to GA4's own layout.
Data source: connect your GA4 property. If search visibility matters to the business, add Search Console as a second data source with Data Studio's own Search Console connector for a query-performance table. Search Console data runs about two days behind, so the latest days will look low.
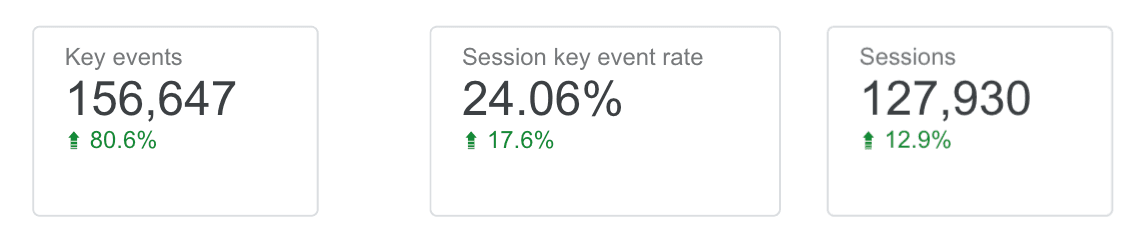
KPI row: four scorecards along the top — Key events, Session key event rate, Sessions (context, not the headline), and one channel-specific Key events figure if one channel dominates spend. Turn on Comparison date range → Previous period for each (Setup panel, not a separate chart) so every card shows its own trend arrow without a second chart to read.
Channel table: Session source / medium as the dimension, Key events as the metric, not Sessions. This is the table that should decide next month's ad spend.
Landing page table: Landing page as the dimension, with both Sessions and Key events as metrics side by side, sorted by Key events descending. Seeing both columns next to each other is what makes the gap between traffic and outcome visible at a glance, rather than needing two separate tables.
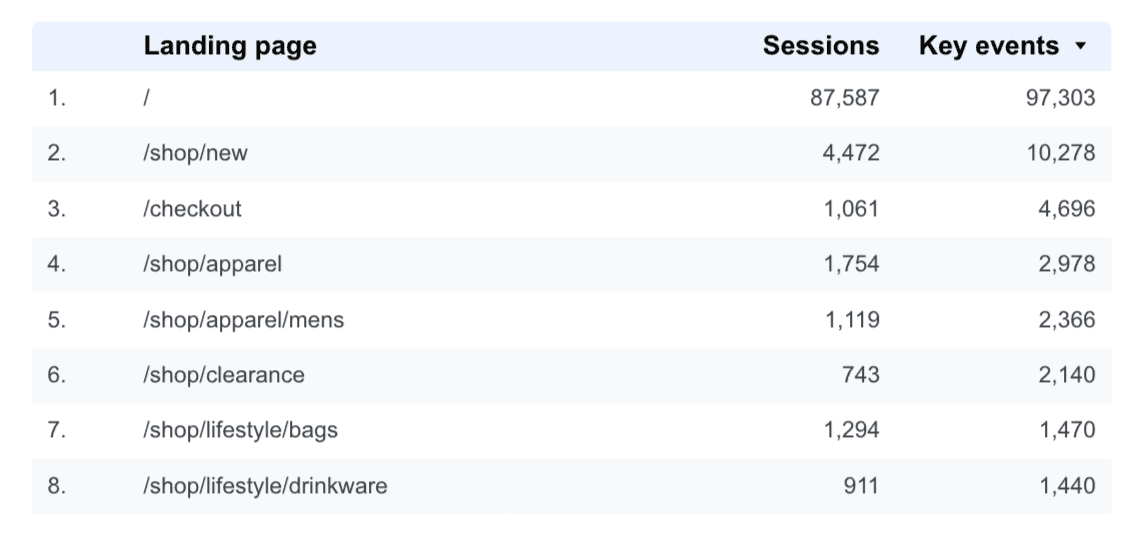
One thing to watch: Data Studio's default table sort usually follows whichever metric you added first, which tends to be Sessions out of habit. Re-check the sort column after adding Key events — it's an easy step to skip, and it quietly turns your outcome-led table back into a popularity ranking.
What to leave off
Not because these numbers are wrong, but because they don't belong on the first screen an executive opens:
- Bounce rate / engagement rate as a headline tile. Useful once you're diagnosing a specific page, misleading as a growth indicator on its own.
- New vs. returning users as a KPI card. Worth a glance in the full report, rarely worth a decision on its own.
- Any tile that exists because a template included it, not because someone in the business asked the question it answers.
Keep the dashboard to what fits one screen without scrolling. A 20-tile report doesn't get checked weekly; a 6-tile one does.
Common questions
Should I stop looking at sessions and traffic entirely?
No — keep them as a diagnostic layer underneath the outcome metrics, not as the headline. If Key events drops, Sessions and channel mix are usually the first place you look to find out why.
Do I need Data Studio, or is GA4's own reporting enough?
GA4's customized Reports snapshot covers a quick personal daily check well. Data Studio is worth the extra setup once you need to blend in Search Console data, or share the dashboard with people who don't have (or shouldn't have) GA4 access.
How often should this actually get reviewed?
Weekly, for most small and mid-size sites — anywhere under a few hundred Key events a month, where a single day's count is too small to read as a trend on its own. The previous-period comparison arrows are what make a weekly glance useful instead of requiring a full re-analysis each time. If you're doing enough volume that daily swings are meaningful, check it daily instead.
Getting a dashboard that reflects the business
A dashboard is only as good as the events feeding it. Clean up what counts as a Key event first, then build the four metrics above around it, and the question "did we get more customers this month" finally has a one-screen answer.
A €250 GA4 audit checks that your key events count real outcomes, so the dashboard you build on them can be trusted.